 |
|||
|
|
My Writing |
||
MethodologyApplying the Darvas MethodThe following article was published in the November 19, 2006 issue of the Break Out Report.
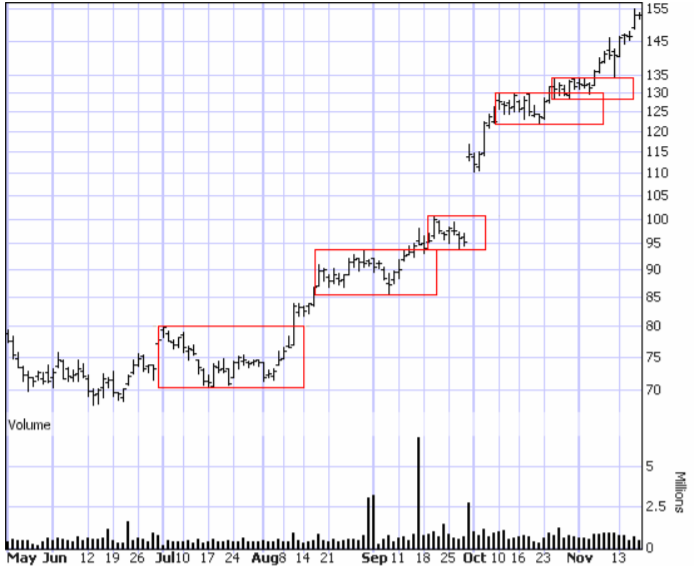
What Darvas observed was that up trending stocks typically advance for a while, then stall and consolidate, then advance again. This stalling and consolidation process he called forming a box. For example, a stock might have the following price pattern 22, 25, 24, 26, 27, 30, 29, 29, 27, 28, 29, 29, 30, 28, 29. The stock advanced from 22 to 30 and then started stalling and consolidating, falling back to 27. The pattern above would, in Darvas view, have formed a box or frame with a high of 30 and a low of 27. The stock oscillates between those figures. The upper edge of the box is formed when the stock retreats from its high and stays below it for three consecutive days. So the move from 25 to 24 did not signal the top of a box as the stock moved up again after that. But when it hit 30, it stayed below that level. After the top of a box is formed, the bottom is formed when the stock advances from a low for three consecutive days without breaking out of the box to the upside. In our example, it is 27. This Darvas would call a 27/30 box which is a pretty tight frame. The depth of the box may vary each time one is formed. Once a box is firmly established, Darvas says a break out above the upper line of the box is a buy signal. A drop below the bottom of the box is a sign that the stock’s trend has changed and a sell signal. Darvas was also very keen on volume. Increasing volume on a rising stock indicated buyer interest. Once he discovered a stock that was rising with increasing volume, he would wait for a box to develop. Then he would issue an on stop buy order to buy the stock when it broke out of the box. An on stop buy order is the opposite of a stop loss order. It is an instruction to your broker to buy the stock only after it has climbed to a certain level. It seems almost counter-intuitive to the way most investors think. Many, if not most, would think “buy low” and tell their brokers, when the stock drops to this level, buy me some. The on stop buy order says I’m not interested until the stock has proven itself by climbing to a certain level. It is the tool in trade of the contrarian investor who, instead of following the rule of buy low, sell high, follows the rule of buy high, sell higher. I used to think this was a crazy idea until I read William O’Neil’s How to Make Money in Stocks. In fact, there are many similarities between O’Neil’s CANSLIM method and Darvas’s approach. In our example, Darvas would issue a buy order at 31. Immediately he would also issue a stop loss order at the top of the box or 30 in our example. He reasoned that if the stock was behaving correctly, it should advance once it broke out of the box. If it retreated, he had made a mistake and wanted to be out of the stock quickly with a minimal loss. He recognized that this might result in being stopped out quite a few times, but the advances would take care of that. It was the famous financier and advisor to presidents, Bernard Baruch, who once said “Even being right 3 or 4 times out of 10 should yield a person a fortune if he has the sense to cut his losses quickly on the ventures where he has been wrong.” A point reiterated by Darvas. The best way to see the Darvas box method is graphically. Consider Research in Motion. This stock had been on a solid up trend from early 2003 through the end of 2004, rising from $8.50 to $110. The stock then drifted in a wide sideways pattern to mid-2006, fluctuating between $70 and $105. Now Darvas only bought stocks that were hitting all time highs. Research in Motion hit an all time high of $130 (split adjusted) on February 28, 2000, so Darvas may not have been interested in RIM until it broke through that high. But for the sake of our example, we’ll look at the boxes since June. We rated Research in Motion a buy again on July 10th using our method of a bounce off the 30 day moving average after a change in direction of the moving average to the upside. So we’ll look at the boxes since then.
As you can see, there have been five Darvas boxes formed since we issued our buy rating on July 10th. Darvas probed his stocks by buying in increments. If he had bought when we rated Research in Motion a buy, he likely would have sold when it hit 75, bought back in when it broke above 80, bought some more when it broke above 94 and bought a lot more when it spiked up on Sept. 29th. And if he was not yet fully invested at the time, he would have bought more when the stock broke above 130 and even more above 134. Each break out from a box to the upside is a buy signal. The chart above graphically shows how boxes pyramid upwards in an up trending stock. Sometimes, as in the last two boxes, they overlap. Darvas used stop losses, the initial one very tight but subsequent ones a bit looser. When a new box formed, Darvas would raise the stop to the bottom of the new box. In the case of Research in Motion, he would have raised the stops progressively to 86, 94, 122 and 128. which would be the current stop. The trailing stop using our current system is a bit looser at $122.50. As I noted at the beginning of this article, Darvas’s results cannot be easily duplicated. The reason is because of a Darvas idiosyncrasy he shared with Jesse Livermore. He was a plunger. He followed very few stocks and invested in even fewer. And when he did, he went whole hog and used margin, a dangerous prescription. For example, after some initial successes had built up his capital position, he bought 500 shares of E.L. Bruce (makers of Bruce Hardwood Flooring which is still around today) at 50 ¾ . He bought another 500 shares at 51 1/8, another 500 at 51 ¾ another 500 at 52 ¾ and a final 500 shares at 53 5/8. He bought $130,687.55 worth of this one stock. It was his only holding and 50% of that was on margin. Plunger indeed! Then Darvas got very lucky indeed. Unknown to the general public, Bruce was the subject of takeover negotiations. Short sellers, not knowing this, pooh-poohed the rise in price and start selling short. As the price continued to rise, the shorts were in a frenzy trying to sell and close their positions. Things got so crazy that trading in the stock was halted. The shorts scrambled to buy the stock over-the-counter privately. Darvas broker told him he could sell out for $100 a share. Then he did something most people would probably not have the guts to do. He told his broker no and hung on. The offers went up and eventually Darvas sold out all his Bruce at an average price of $171. He made a profit of $295,305.45. Now that is a combination of skillful stock picking, high risk (by ignoring the usual advice of diversifying), guts and just plain good luck. So replicating Darvas would take a combination of guts and foolishness most people just do not have. That said, his box method is intriguing and fairly easy to follow. I will be adopting some of his methods in managing my Model Portfolio as noted with our stock picks this issue. I will look for stocks just breaking out of their Darvas boxes, preferably on good volume. We’ll have to watch and see how this works out over time! |
|
||
|
|
|||
|
Contents copyright ©
Marco den Ouden All Rights reserved |
|||
|
|
|||